Website Heatmaps and Scroll Tracking: Analyzing Content Engagement for SEO
Integrate Microsoft Clarity and Hotjar scroll tracking data with SEO analytics to optimize content readability and call-to-actions.
Key Takeaways
- Heatmaps highlight which parts of a page users click, read, or skip.
- Scroll tracking reveals if target readers reach your primary call-to-action.
- High bounce rates combined with low scroll depth indicate searcher intent mismatch.
Securing a high organic search ranking is only half the battle. If a user clicks your link, lands on your page, and bounces back to the search results page immediately, search engine algorithms interpret this as a sign of unhelpful content. This behavior, known as pogo-sticking, negatively impacts your ranking positions.
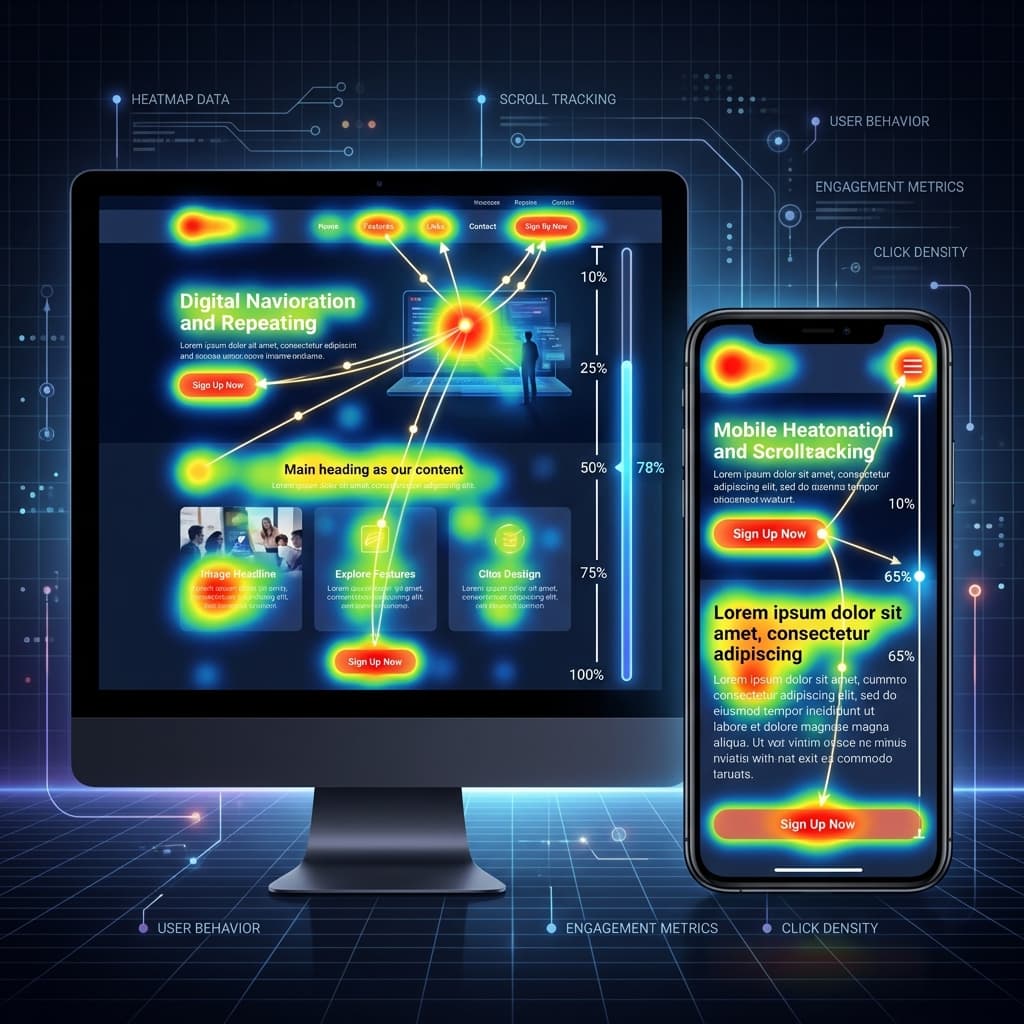
To capture and keep search traffic, you need to understand how users interact with your pages. Website Heatmaps and Scroll Tracking provide visual, behavioral feedback that helps you identify where users get stuck, what they ignore, and how far down the page they read.
1. Key User Engagement Metrics
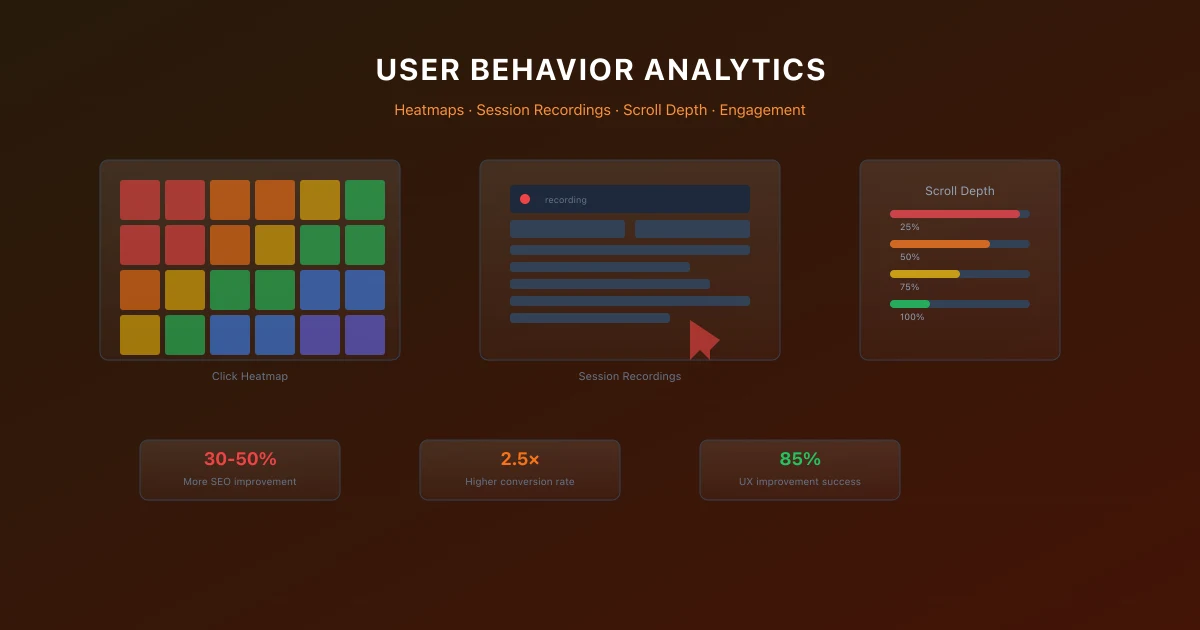
Quantitative tools like Google Analytics show page views and session durations, but they don't show how a user consumes a page. Behavioral tracking tools (like Microsoft Clarity or Hotjar) fill this gap by tracking:
- →Average Scroll Depth: The percentage of the page height the user scrolled through. For blog posts, this reveals if readers are dropping off before reaching key sections or call-to-actions (CTAs).
- →Dead Clicks: Clicks on elements that are not interactive (like static images, plain text, or non-linked icons). This indicates a user expecting an action that the interface does not support.
- →Rage Clicks: Rapid, repeated clicks in the same area. This indicates user frustration caused by slow-loading elements, broken buttons, or confusing layouts.
- →Quick Backs: Sessions where a user navigates to a page and quickly returns to the previous page, signaling a mismatch between search intent and page content.
2. Programmatic Scroll Tracking using IntersectionObserver
While Google Analytics 4 includes scroll tracking automatically, it only fires an event when a user reaches the 90% scroll milestone. For detailed content audits, you need to capture incremental progress (e.g., 25%, 50%, 75%).
You can build a lightweight, high-performance scroll observer using the browser's IntersectionObserver API without relying on resource-intensive scroll event listeners:
// File: src/lib/analytics-scroll-tracker.js
export function initializeScrollTracking(sendTelemetryEvent) {
  if (typeof window === 'undefined') return;

  const milestones = [25, 50, 75, 100];
  const trackedMilestones = new Set();

  milestones.forEach((percent) => {
    // Create dummy sentinel elements at incremental depths
    const sentinel = document.createElement('div');
    sentinel.style.position = 'absolute';
    sentinel.style.top = `${percent}%`;
    sentinel.style.left = '0';
    sentinel.style.width = '1px';
    sentinel.style.height = '1px';
    sentinel.style.pointerEvents = 'none';
    sentinel.setAttribute('data-scroll-sentinel', percent);

    document.body.appendChild(sentinel);

    const observer = new IntersectionObserver(
      (entries) => {
        entries.forEach((entry) => {
          if (entry.isIntersecting && !trackedMilestones.has(percent)) {
            trackedMilestones.add(percent);

            // Push event to your analytics provider
            sendTelemetryEvent('scroll_depth', {
              depth_percentage: percent,
              page_path: window.location.pathname,
            });

            // Disconnect observer once milestone is reached
            observer.disconnect();
          }
        });
      },
      { threshold: 0.1 }
    );

    observer.observe(sentinel);
  });
}
3. Integrating Tracking Scripts Without Degrading Core Web Vitals
Adding tracking scripts to your site can slow down rendering and increase Total Blocking Time (TBT). To prevent these performance penalties:
- Defer Script Execution: Never load tracking scripts in the document head without optimization. Use the
deferorasyncattribute to load them after the browser finishes parsing critical HTML and CSS. - Use Connection Preloading: Add
dns-prefetchandpreconnectheaders to resolve domain lookups before loading the script files.
<Script /> component with the afterInteractive or lazyOnload loading strategies:
import Script from 'next/script';

export default function AnalyticsScripts() {
  return (
    <>
      {/* Establish early connection */}
      <link rel="preconnect" href="https://c.bing.com" />

      {/* Load tracking code after the page is interactive */}
      <Script
        id="clarity-analytics"
        strategy="afterInteractive"
        dangerouslySetInnerHTML={{
          __html: `
            (function(c,l,a,r,i,t,y){
                c[a]=c[a]||function(){(c[a].q=c[a].q||[]).push(arguments)};
                t=l.createElement(r);t.async=1;t.src="https://www.clarity.ms/tag/"+i;
                y=l.getElementsByTagName(r)[0];y.parentNode.insertBefore(t,y);
            })(window,document,"clarity","script","your_clarity_project_id");
          `,
        }}
      />
    </>
  );
}
4. Content Optimization Based on User Data
Once you collect enough click and scroll data, use this three-step playbook to optimize your layout:
- →Address Drop-off Points: If your scroll map shows a sharp drop in traffic (e.g., from 80% to 40% at the middle of the article), it indicates a section that is too dry, too long, or irrelevant. Rewrite this section, add supporting images, or use formatting to break up text.
- →Reposition Call-to-Actions: If your primary sign-up form sits at the footer (95% depth) but only 10% of users scroll that far, move a secondary CTA to the 40% scroll level to capture more leads.
- →Resolve Dead Clicks: If click heatmaps reveal users clicking on static images, add external links or enlarge images in modal popups to satisfy their expectations.
Official References
Frequently Asked Questions
Does scroll tracking impact page speed performance?
No, if you load the tracking scripts server-side or defer client execution, it will not affect Core Web Vitals.
What is the difference between bounce rate and scroll depth?
Bounce rate tracks users who leave after viewing a single page. Scroll depth tracks how much content they read, which is a better measure of engagement for long-form articles.
How can I track scroll milestones without GTM?
You can write a lightweight JavaScript script using the IntersectionObserver API to capture when specific parts of the page enter the viewport and push events to your analytics tool.
What scroll depth is considered good for blog posts?
A scroll depth of 50% or higher is excellent for long-form content. It indicates that visitors are engaged and reading beyond the first few sections.
Does tracking scripts slow down page speed?
If loaded synchronously, yes. Always load tracking scripts (like Hotjar or Microsoft Clarity) asynchronously or execute them via server-side tagging.
How can heatmaps help reduce bounce rates?
Heatmaps show where users click or get frustrated. Fixing broken links, adjusting element spacing, and moving important elements higher can improve engagement.

Founder & Editor, TechSEO Insights
The TechSEO Editorial Team writes practical SEO, AI tools, and web development guides based on hands-on research, testing, and real website optimization work.
Subscribe to TechSEO Insights
Get the latest guides on technical SEO, Core Web Vitals, and content marketing delivered straight to your inbox.
Privacy Note: By subscribing, you agree to receive our newsletter (Lawful Basis: Consent). We retain your email address until you choose to unsubscribe. For more details, view our Privacy Policy.