SEO KPI Dashboards and Reporting: Measuring What Matters
Build effective SEO KPI dashboards that communicate real business impact.
Advertisement
Key Takeaways
- Focus on business outcomes first, SEO metrics second
- Segment KPIs by audience: executive, manager, and [technical](/blog/technical-seo-audit-checklist)
- Automate data collection to eliminate manual reporting
- Use comparative periods to provide context for every metric
- Include leading indicators alongside lagging indicators
SEO reporting is broken at most organizations. Teams track dozens of metrics and still fail to answer the one question executives care about: Is SEO driving business results?
The problem is not a lack of data. It is a lack of focus. An effective SEO dashboard shows the right things in context. According to a 2025 survey by Conductor, 68 percent of SEO professionals say their reporting fails to communicate value to non-SEO stakeholders. Teams with executive-facing dashboards were 3.4 times more likely to secure additional budget.
Defining the Right KPIs
Not all metrics belong on your dashboard. Choose KPIs that connect SEO activities to business outcomes.The KPI Hierarchy
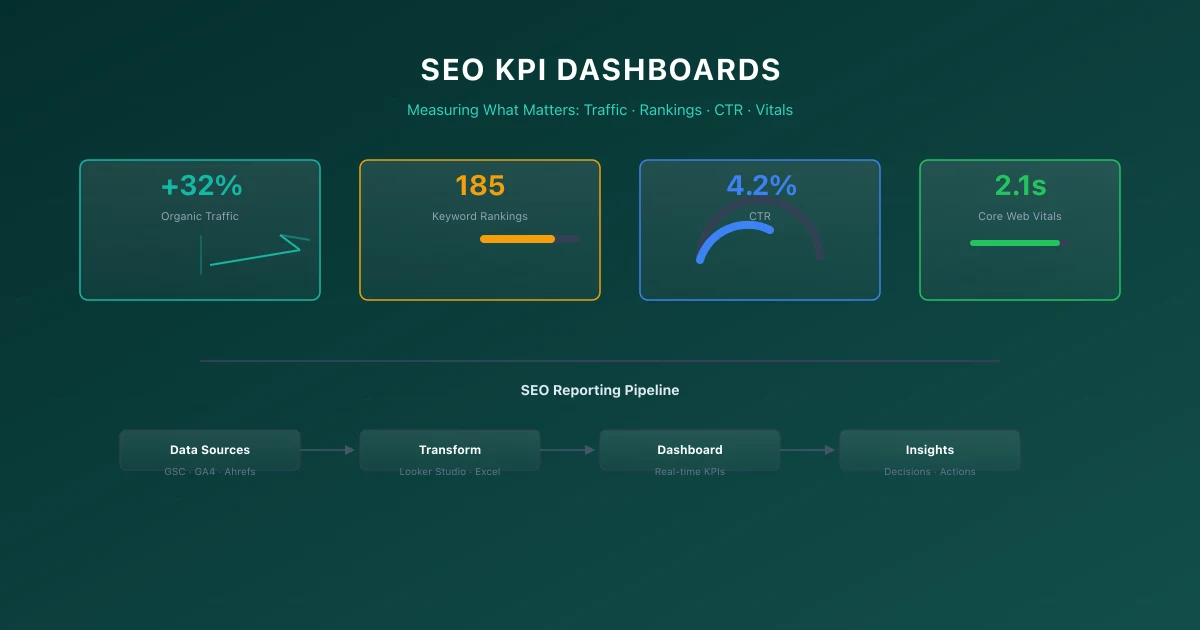
Organize KPIs into three tiers. Executive KPIs include organic revenue, conversion rate, and overall visibility. Manager KPIs include organic sessions, keyword distribution, and brand versus non-brand split. Technical KPIs include indexed pages, crawl budget utilization, and Core Web Vitals pass rate.Leading vs. Lagging Indicators
Lagging indicators tell you what happened. Leading indicators suggest what will happen. For traffic, lagging is total sessions and leading is featured snippet acquisitions. A balanced dashboard includes both types.Building Dashboards in Looker Studio
Looker Studio connects to GSC and GA4 directly. Build dashboard pages organized by audience: an Executive Summary with 5-7 key metrics, Channel Performance with trend lines, Content Analysis for strategy decisions, and Technical Health for the SEO team.For GA4 integration techniques, refer to our Google Analytics 4 guide.
Reporting Cadence
Different stakeholders need different frequencies. Weekly reports focus on tactical execution including keyword position changes and indexing issues. Monthly reports focus on strategy with month-over-month trends and competitive analysis. Quarterly reports focus on business impact with revenue attribution and year-over-year comparisons.Automated Reporting Setup
Set up Looker Studio to email PDF reports on a schedule. Set up alerts for significant metric changes: traffic drops over 15 percent, index coverage shrinkage, or Core Web Vitals pass rate declines.For monitoring frameworks, see our technical SEO audit checklist.
Analytics Measurement Framework
| Funnel Stage | Recommended Metric | Tool/Method |
|---|---|---|
| Awareness | Organic Impressions & Clicks | Google Search Console |
| Engagement | Average Engagement Time | Google Analytics 4 |
| Conversion | Custom Signups & Event Submissions | GA4 Custom Events |
| Retention | Return Visitor Rate | GA4 Cohort Analysis |
Common Mistakes
- →Targeting Search Volume Over Intent: Creating high-volume informational pieces when the query has a commercial purchase intent leads to zero conversions.
- →Failing to Track Engagement Metrics: Focusing purely on organic sessions while ignoring average engagement time can hide the fact that content is thin or unhelpful.
- →Ignoring Content Decay: Publishing new posts while letting older, high-ranking pages decay without refreshes leads to a drop in overall domain visibility.
- →Publishing AI content without human editing: Raw AI output lacks personal experience and original expert points, violating search guidelines.
When This Does Not Apply
- →Breaking News Media: Real-time reporting blogs prioritizing publishing velocity do not need deep topic clusters, complex metadata, or historical updates.
- →Internal Strategy & Client Reporting: Confidential data analysis presentations or internal dashboard reports do not require public-facing metadata, indexing, or Schema markups.
Official References
Advertisement
Frequently Asked Questions
What is the most important SEO KPI for executives?
Organic revenue or conversion value. Executives need financial impact, not traffic volume.
How often should I update my SEO dashboard?
Daily refresh is ideal. Automated reports can be scheduled based on stakeholder needs.
What is the best free tool for SEO dashboards?
Looker Studio. It connects directly to GSC and GA4 and supports custom data sources through [Google](/blog/google-analytics-4-guide) Sheets.
How do I measure SEO ROI effectively?
Track conversions from organic traffic, apply a value to each conversion, and subtract SEO costs.

Full-Stack Developer & Web Architecture Engineer
Liam O'Brien is a Full-Stack Developer with 8+ years of experience building high-performance web applications. He specializes in Next.js, React, and Node.js, with a deep focus on web architecture, performance optimization, and technical SEO. Liam has architected front-end systems for e-commerce platforms handling 10 million+ monthly visitors and has contributed to major open-source projects including Next.js core and React documentation. He is passionate about server-side rendering, edge computing, and building scalable web applications that deliver exceptional user experiences. Liam writes about modern JavaScript frameworks, performance patterns, web vitals optimization, and building for search engine crawlers. He believes that great engineering and great SEO go hand in hand.
Comments are temporarily unavailable.
Stay Updated
Get the latest articles and SEO insights delivered to your inbox.
No spam. Unsubscribe anytime.
Related Articles

Measuring Content Marketing ROI: Metrics That Matter
Learn how to measure content marketing ROI with the right metrics, attribution models, and reporting frameworks that connect content to revenue.

Content Refresh Strategy: Reviving Underperforming Pages
Systematically identify and refresh underperforming content to reclaim lost traffic, improve rankings, and maximize the ROI of your existing content library.
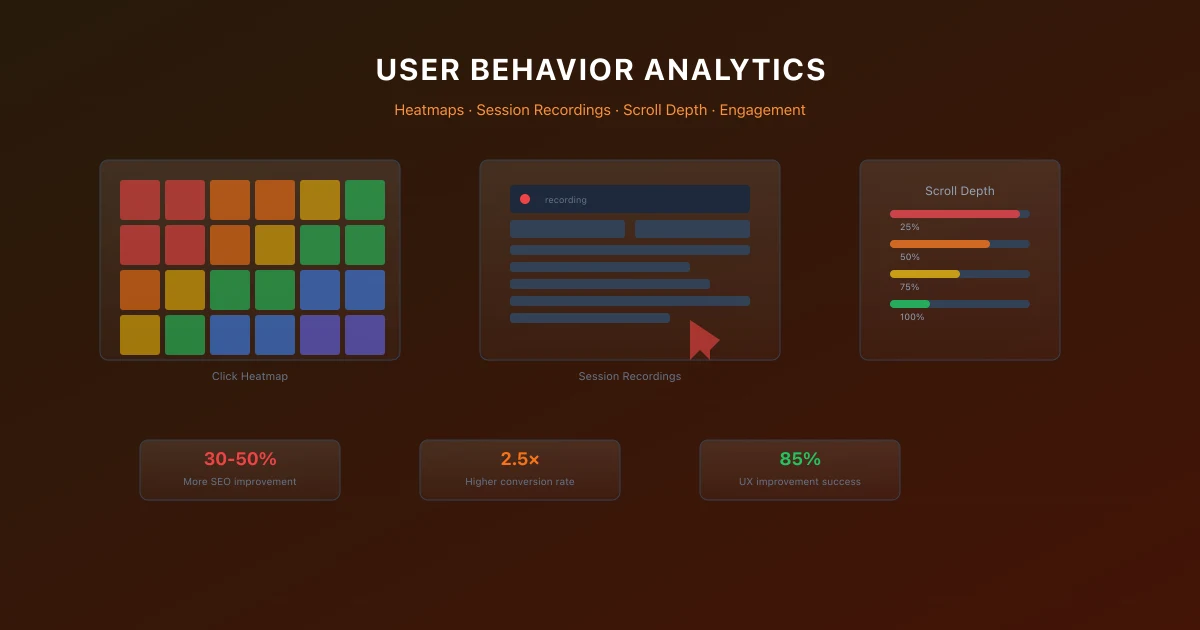
User Behavior Analytics for SEO: Understanding Your Audience
Use user behavior analytics with heatmaps, session recordings, and scroll depth tracking to improve SEO performance.
Advertisement